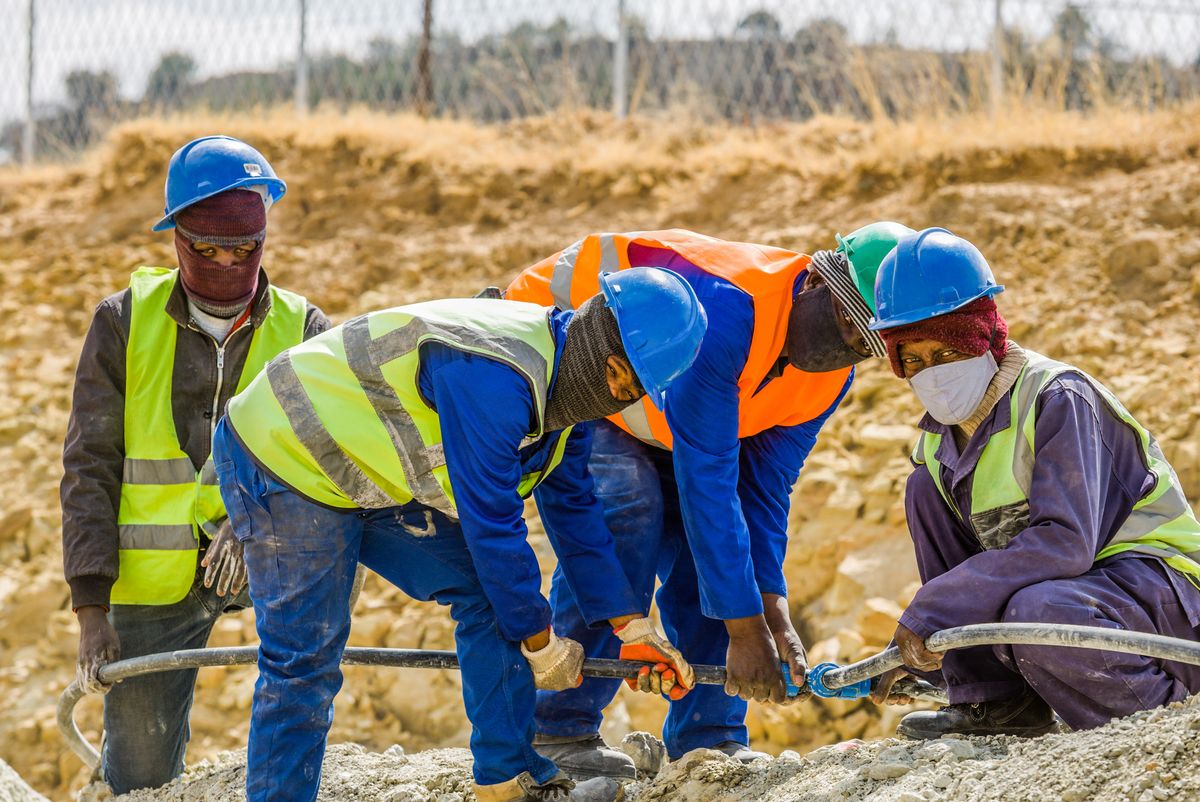
A national workplace-fatality rate is an average, and an average hides who is actually dying. In 2024, the United States recorded a fatal-injury rate of 3.3 per 100,000 workers, down from 3.5 in 2023. But dissolve that single number into who the 5,070 dead actually were, and it fractures into populations living at wildly different levels of risk. Some workers die at close to the average. Others — older workers, Hispanic and Latino workers, the self-employed — die well above it. This analysis is about that fracture, because a safety program aimed at the average protects the average worker, not the most exposed one.
At a glance (BLS CFOI, 2024): national rate 3.3/100k · workers 65+: 824 deaths, rate 9.1 (~2.8× the average) · 55–64: 1,031 deaths · workers 55+ = 1,855 (37% of all deaths) · Hispanic/Latino: 1,229, rate 4.3, 68.5% foreign-born · Black: 624, rate 3.4 · self-employed: 888. Source: BLS CFOI Table 1.
Key findings — who dies at work
- Age is the biggest divider. Workers 65+ have the highest fatal-injury rate of any age group: 9.1 per 100,000 in 2024, nearly three times the all-worker average.
- The workforce is aging into the risk. Workers 55 and older were 1,855 of the 5,070 deaths in 2024 — about 37%.
- Hispanic and Latino workers die above the average. A rate of 4.3 vs 3.3 nationally, and 68.5% of those deaths were foreign-born.
- The self-employed fall outside the net. 888 deaths among a group many OSHA standards don't even cover.
- The average is a mirage. "3.3" describes almost no one; real risk clusters by age, ethnicity, and employment status.
Age: the steepest gradient in the data
If you had to predict which worker on a site is most likely to die from an injury, the single most useful fact is not the trade — it is the age. From the mid-twenties on, fatal-injury rates climb with every age band (2.5 at 25–34, 3.1 at 45–54, 4.1 at 55–64), then jump to 9.1 at 65 and over.
Older workers carry the highest fatal-injury rate
Source: BLS CFOI 2024, hours-based fatal injury rates (65+ is the highest of any age group; 55–64 is next). 2024 counts: 824 deaths at 65+, 1,031 at 55–64.
The mechanism is not mysterious. Older workers are not more careless — they are more fragile: the same fall, the same struck-by event, the same heat exposure is more likely to be fatal for a 68-year-old than a 28-year-old. And the exposure isn't shrinking. As Americans work later in life, the share of deaths among workers 55 and over keeps rising — 1,855 of the 5,070 deaths in 2024, about 37%. An aging workforce means the highest-risk group is also a growing one, which is a reason to design controls (fall protection, heat acclimatization, task rotation) around the least resilient worker on the crew, not the average one. The fall rule sets no age adjustment: protection starts at 6 feet in construction (29 CFR 1926.501(b)(1)) and 4 feet in general industry (29 CFR 1910.28(b)(1)(i)) for everyone.
Ethnicity: a rate above the average, concentrated among the foreign-born
The second fracture is by race and ethnicity, and the sharpest edge is the persistent over-representation of Hispanic and Latino workers.
Fatal-injury rate by group, 2024
Deaths per 100,000 FTE workers · against the 3.3 national rate
Source: BLS CFOI 2024. Hispanic/Latino workers: 1,229 deaths, rate 4.3, of which 68.5% (842) were foreign-born. Black or African American workers: 624 deaths, rate 3.4. Bars scaled to the highest rate (4.3).
Hispanic or Latino workers were killed at 4.3 per 100,000 — a third higher than the national rate — and 68.5% of those deaths were among the foreign-born. That concentration among immigrant workers has been one of the most stable and troubling patterns in the entire fatality record. The drivers are structural: over-representation in the highest-hazard trades, language barriers that blunt training and hazard communication, and, for some, a reluctance to raise safety concerns. It is a direct argument for hazard communication and training that actually reach a multilingual workforce — Spanish-language SDS access and bilingual training are not a nicety here; they are a fatality-prevention control. The rule keeps English as the base: the SDS must be in English, with copies in other languages allowed (29 CFR 1910.1200(g)(2)), and workplace labels may carry the information in another language alongside English (29 CFR 1910.1200(f)(10)). What the standard actually requires on language, and what it leaves optional, is laid out in Does OSHA require SDSs in Spanish?.
Employment status: the workers OSHA doesn't cover
The third fracture is quieter but important: 888 self-employed workers died in 2024, and many of them sit outside OSHA's reach entirely. OSHA's standards protect employees; a genuinely self-employed sole proprietor, an owner-operator, or an unpaid family worker on a farm often has no OSHA coverage at all. That means the entire apparatus of standards, inspections, and citations — the safety net this whole series analyzes — simply does not extend to a meaningful slice of the people dying on the job. For them, there is no General Duty Clause backstop; there is only their own judgment.
The rules that reach the most-exposed worker
| Who is most exposed | What the rule requires | Rule |
|---|---|---|
| Any worker new to a chemical hazard | Effective information and training at initial assignment | 29 CFR 1910.1200(h)(1) |
| Workers who read another language | An SDS in English, with copies in other languages allowed | 29 CFR 1910.1200(g)(2) |
| Workers who read another language | Workplace labels in English, with their language added if the employer chooses | 29 CFR 1910.1200(f)(10) |
| Workers exposed to blood | Training material suited to their education, literacy, and language | 29 CFR 1910.1030(g)(2)(vi) |
| Construction workers | Instruction in the recognition and avoidance of unsafe conditions | 29 CFR 1926.21(b)(2) |
| Older workers at height, construction | Fall protection at 6 feet or more | 29 CFR 1926.501(b)(1) |
| Older workers at height, general industry | Fall protection at 4 feet or more | 29 CFR 1910.28(b)(1)(i) |
| Older workers in heat | Potable drinking water in all places of employment | 29 CFR 1910.141(b)(1)(i) |
| Workers reluctant to report | No discharge or discrimination for reporting an injury | 29 CFR 1904.35(b)(1)(iv) |
| Workers reluctant to report | Section 11(c) of the OSH Act also protects reporting | 29 CFR 1904.36 |
| Workers who want an inspection | Any employee or representative may request one | 29 CFR 1903.11(a) |
| Every covered death | A report to OSHA within 8 hours | 29 CFR 1904.39(a)(1) |
The average is the wrong target
Put the three fractures together and the lesson for an EHS professional is concrete: manage to the most-exposed worker, not the average one. The national 3.3 rate describes a composite that almost no individual matches. On a real crew, the risk is loaded onto the 66-year-old, the recent immigrant whose training was in a language he half-understood, and the owner-operator with no safety program at all. A control set designed for the median worker leaves exactly those people exposed.
Build safety for the most-exposed worker on the crew
The data says risk clusters — by age, language, and employment status. HazComFast helps you deliver hazard communication and training that reach every worker, in the language they need, and document that they got it.
Methodology and limits
- Source and vintage. All figures are from the BLS Census of Fatal Occupational Injuries, 2024 reference year (released Feb 19, 2026), Table 1 — demographic characteristics. Counts are a census; rates are per 100,000 FTE workers.
- Age rates are 2024 rates. The 9.1 (65+) and 4.1 (55–64) rates come from the BLS hours-based fatal injury rate tables for 2024; the age counts (824 at 65+; 1,031 at 55–64) come from CFOI Table 1. Self-employed workers, a category rather than an age band, ran higher still (10.8).
- Rates need a denominator. A group's rate depends on how many of them work; higher rates reflect both more-hazardous work and, for older workers, greater physical vulnerability to the same event.
- "Self-employed outside OSHA" is general. Coverage has nuances (some incorporated owners are treated as employees); the point is that a large share of the self-employed lack OSHA protection, not that every one does.
- This is descriptive. It identifies where risk concentrates, not the full causal story behind each pattern. Not legal advice.
Train for the workers the averages hide
The single most important thing the demographic data does is puncture the comfort of the national average. "3.3 per 100,000, down from 3.5" is true and worth noting — and it is also a number almost no real worker actually lives at. The people dying on American jobs are disproportionately older, disproportionately Hispanic and Latino and foreign-born, and disproportionately outside the safety net that standards provide. A safety program that takes the average as its target will, by definition, miss them. The data says: aim lower than the average — at the worker who is most exposed.
Related data studies
- The fatality picture: What 5,070 Workplace Deaths Reveal (CFOI) · The Hidden Toll: Deaths No Census Counts
- Who's most exposed: The Data Behind the Coming Heat Standard · Why Falls Stay OSHA's #1 Construction Hazard
- Reference: OSHA Data & Research
Sources & verification (verified 2026-07-13): All figures from the BLS Census of Fatal Occupational Injuries, 2024 (released Feb 19, 2026), Table 1 (demographic characteristics) and the 2024 hours-based fatal injury rate tables (rates by age and by race or ethnicity). National rate 3.3 per 100,000 FTE (2024). Age: 824 deaths among workers 65+ and 1,031 among 55–64 in 2024 (combined 55+ = 1,855, ~37% of 5,070); fatal-injury rate per 100,000 FTE in 2024 (BLS hours-based rate tables): 65+ 9.1, the highest of any age band; 55–64 4.1. Ethnicity: Hispanic or Latino 1,229 deaths, rate 4.3, 68.5% (842) foreign-born; Black or African American 624 deaths, rate 3.4. Self-employed: 888 deaths (many outside OSHA coverage). Counts are a census; rates are per 100,000 FTE and depend on the working population of each group. Not legal advice.
Frequently Asked Questions
Which age group has the highest workplace fatality rate?
Workers 65 and older, by a wide margin. In 2024 there were 824 fatal work injuries among workers 65+ and 1,031 among workers 55–64. Older workers also die at a far higher rate: in 2024, workers 65+ had a fatal-injury rate of 9.1 per 100,000 full-time-equivalent workers — nearly three times the all-worker rate of 3.3 — the highest of any age band (55–64 came next, at 4.1). As the workforce ages, this gap matters more each year. The fall and heat rules apply at any age: fall protection at 6 feet in construction (29 CFR 1926.501(b)(1)) and potable drinking water in all places of employment (29 CFR 1910.141(b)(1)(i)).
Do Hispanic or Latino workers face higher fatal-injury risk?
Yes. Hispanic or Latino workers suffered 1,229 fatal injuries in 2024 at a rate of 4.3 per 100,000 FTE — above the national rate of 3.3 — and 68.5% of those deaths (842) were among foreign-born workers. The concentration among foreign-born Hispanic and Latino workers has been one of the most persistent patterns in the fatality record for years. HazCom requires effective training at initial assignment (29 CFR 1910.1200(h)(1)) and an SDS in English, with copies in other languages allowed (29 CFR 1910.1200(g)(2)).
How many self-employed workers die on the job?
888 in 2024, according to the BLS Census of Fatal Occupational Injuries. Self-employed workers — including owners of unincorporated businesses and farms, and family workers — are notable because many fall outside OSHA's coverage entirely, so the standards and enforcement that protect employees often do not apply to them at all. The OSH Act places its duties on an employer, defined as a person engaged in a business affecting commerce who has employees (29 U.S.C. 652(5)).
Is workplace fatality risk shared evenly across workers?
No — that is the core finding. Behind the single national rate of 3.3 per 100,000 sit populations living at very different levels of risk: workers 65+ at nearly triple the average (9.1), Hispanic or Latino workers at 4.3, and the self-employed largely outside the safety net. A program built to a national average will under-protect the workers who are actually most exposed. Workers who fear reprisal are protected: an employer must not discharge or discriminate against an employee for reporting an injury (29 CFR 1904.35(b)(1)(iv)).
Where does this demographic data come from?
From the BLS Census of Fatal Occupational Injuries (CFOI), 2024 reference year, released February 19, 2026 — specifically Table 1, fatal occupational injuries by selected demographic characteristics. Counts are a census of confirmed fatal work injuries; rates are per 100,000 full-time-equivalent workers. Rates by age and by race or ethnicity come from BLS's 2024 hours-based fatal injury rate tables. OSHA's own counts come through a different channel: employer reports of work-related deaths within 8 hours (29 CFR 1904.39(a)(1)).
OSHA figures and citations here come from our regulatory source-of-truth modules, last checked against the eCFR, OSHA.gov, and the Federal Register on October 5, 2026. Last reviewed October 6, 2026.
About This Article
Published by: HazComFast
Published: July 13, 2026
Last Updated: October 6, 2026
This content is for informational purposes only and does not constitute legal advice.